UGO / CAB-HAILING APP / ANGOLA
Give the download somewhere to go.
UGO needed to attract new users and get more of its existing users active. Downloads were flat at approximately 2,000 a month, and user participation had declined.
Morph worked across acquisition and re-engagement, with different activity for people discovering the app, people ready to install and people who had installed but remained inactive.

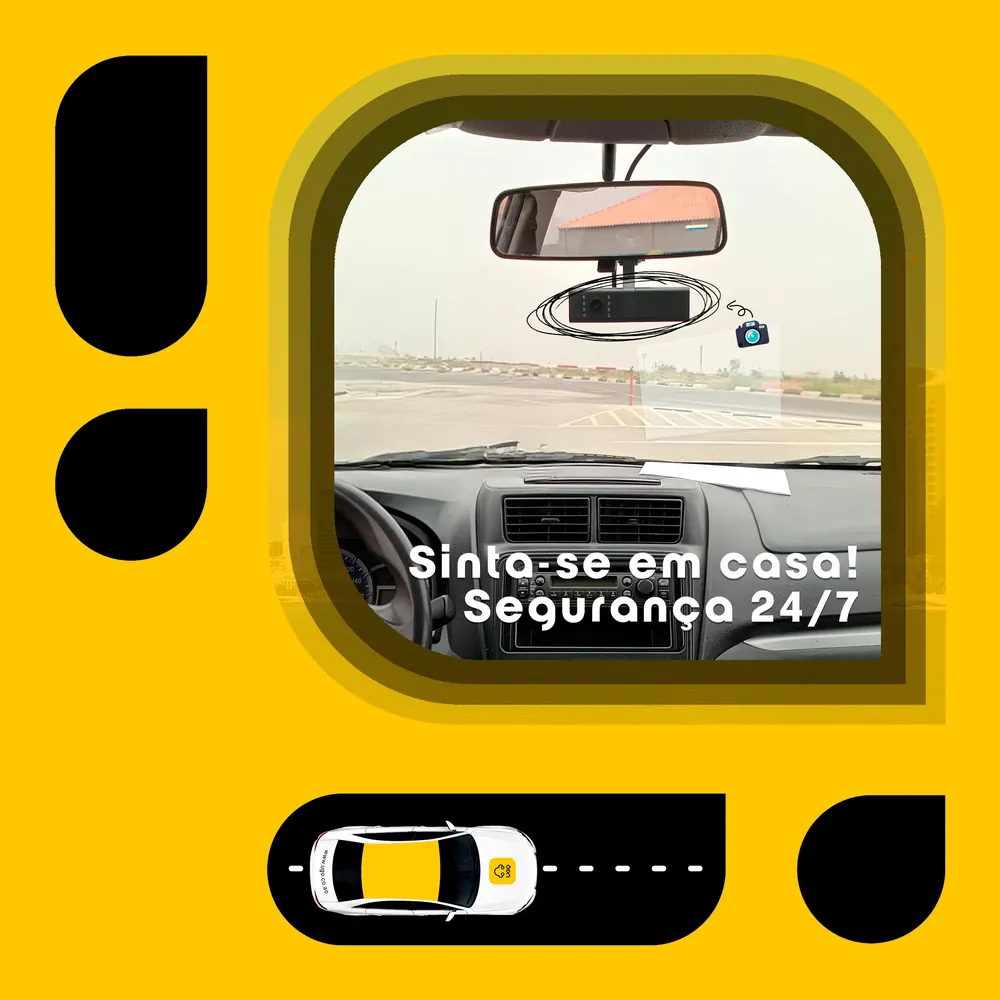
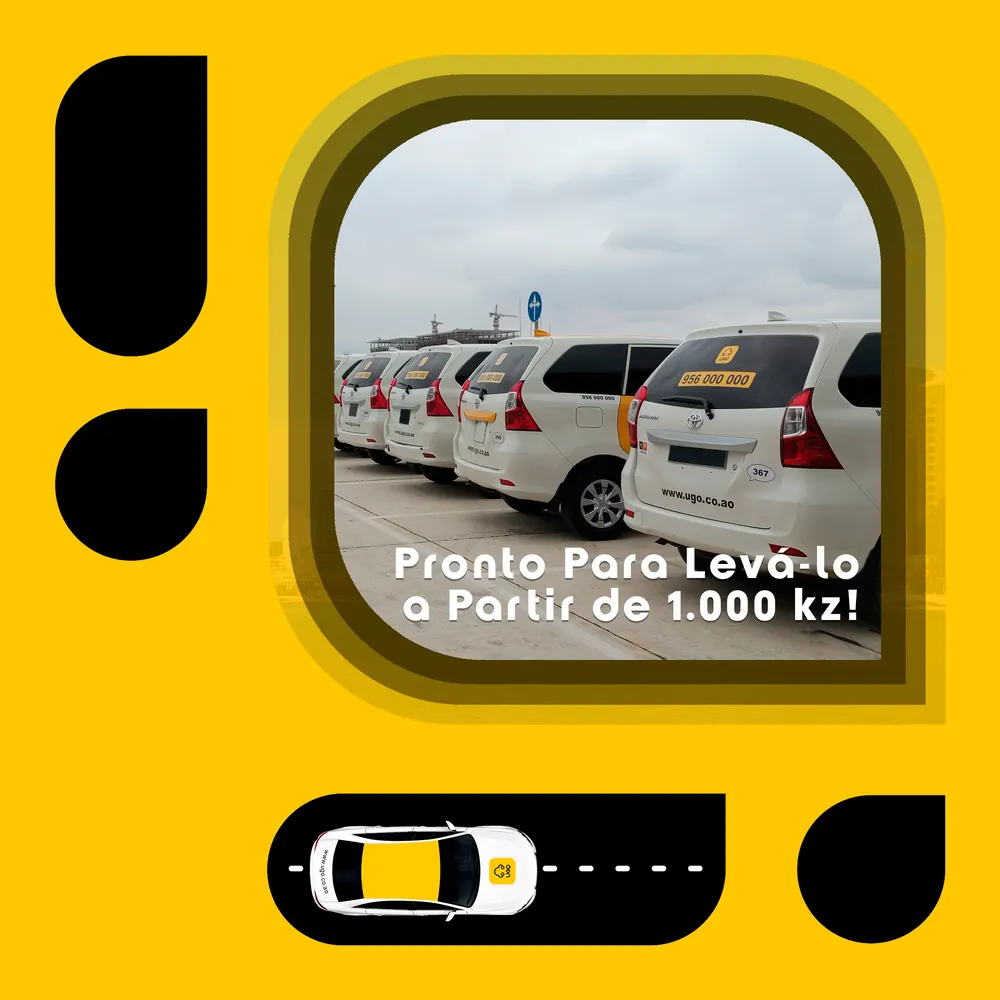

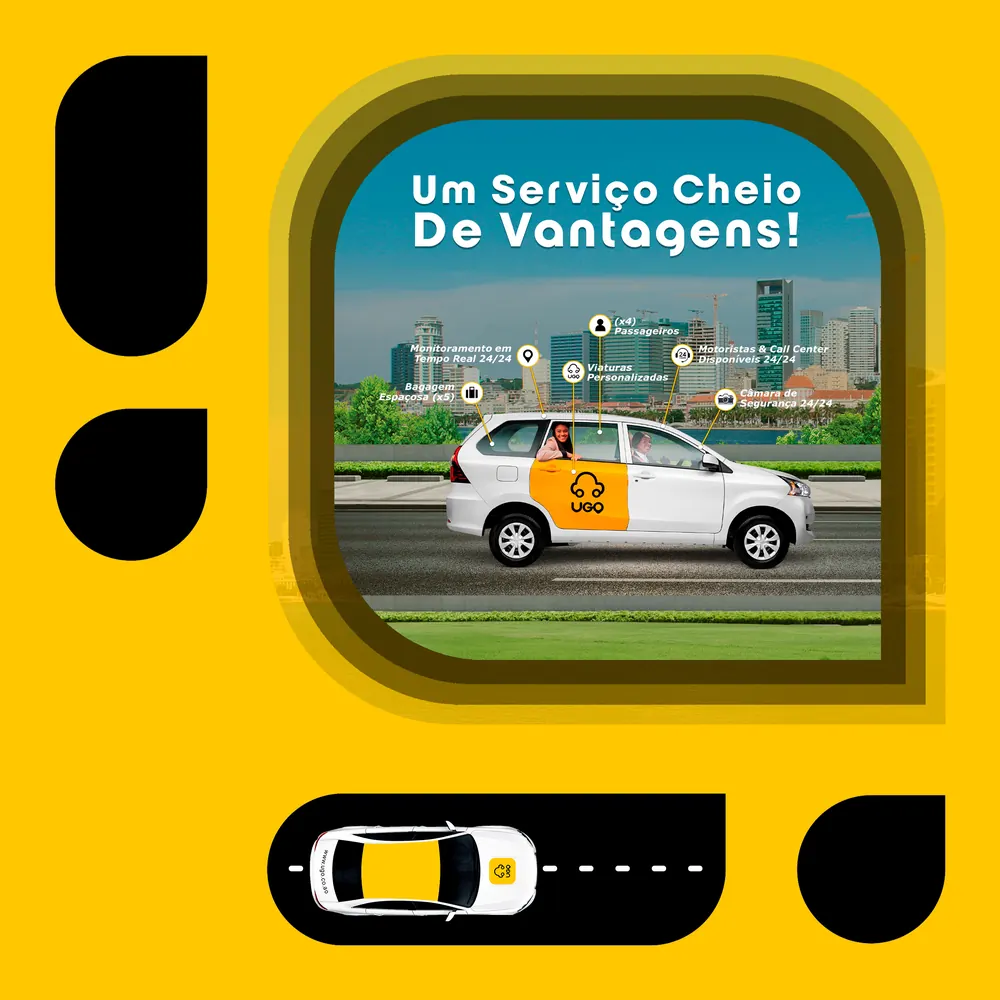

Posts from the campaign, for riders.
A different conversation at each stage.
Awareness creative was localised to Angolan urban audiences. Design and copy addressed affordability, driver trust and safety, with static and video formats tested for response.
App-install campaigns used custom audiences. Retargeting then addressed installed-but-inactive users, repeat users and people who had booked a ride without completing it. That gave the work a purpose beyond adding another icon to someone's phone.
Work to the rhythm of the service.
The campaign used weekly creative tests, geographic targeting and time-specific ad rotation around peak ride hours. Google and Meta activity was supported by app tracking and audience tools, so acquisition and re-engagement could be examined as distinct parts of the journey.
What changed during the 90-day campaign.
| Measure | Starting point | Outcome |
|---|---|---|
| Monthly downloads | Approximately 2,000 | 12,400 within the 90-day campaign, a 520% increase from the starting level |
| User activation rate | 14% | 63%, up 49 percentage points |
| Cost per install | USD 1.30 | USD 0.42, approximately 68% lower |
Monthly downloads reached 12,400 within the 90-day campaign, up from approximately 2,000. This is a monthly download measure, not a cumulative 90-day install total.
Morph's original campaign report attributes 90% of active-user growth to re-engagement loops. That is the report's attribution, not a separate independent causal measurement.
Performance notice: Results describe particular engagements and reporting periods; they are not forecasts. Morph does not guarantee sales, ROI, ROAS, rankings or AI visibility unless expressly stated in an accepted agreement or product-specific terms.
How should the activation change be read?
Activation moved from 14% to 63%, an increase of 49 percentage points. The 63% figure is the resulting activation rate, not the size of the increase. It remains distinct from download volume and retention.
What should happen after someone installs your app?
Bring us the product, the audience and the behaviour you need the next campaign to address.
Bring us the brief
Explore Digital & Performance
Explore Shop & Beyond
Back to all work